
In the ever-evolving landscape of digital marketing, standing out in search engine results has become more competitive than ever. One of the most effective strategies for grabbing attention and boosting your SEO performance is through the use of infographics.
Infographics are not just visually appealing—they’re powerful tools that can significantly impact your website’s visibility, engagement, and traffic. Whether you’re a small business owner, a content marketer, or an SEO specialist, understanding how to create and promote infographics that rank and drive traffic is essential.
This guide will walk you through the entire process, from planning and creating your infographic to promoting it effectively and measuring its success. Let’s dive into the world of infographics and discover how they can elevate your SEO strategy.
What Is Infographics and Why It Matters
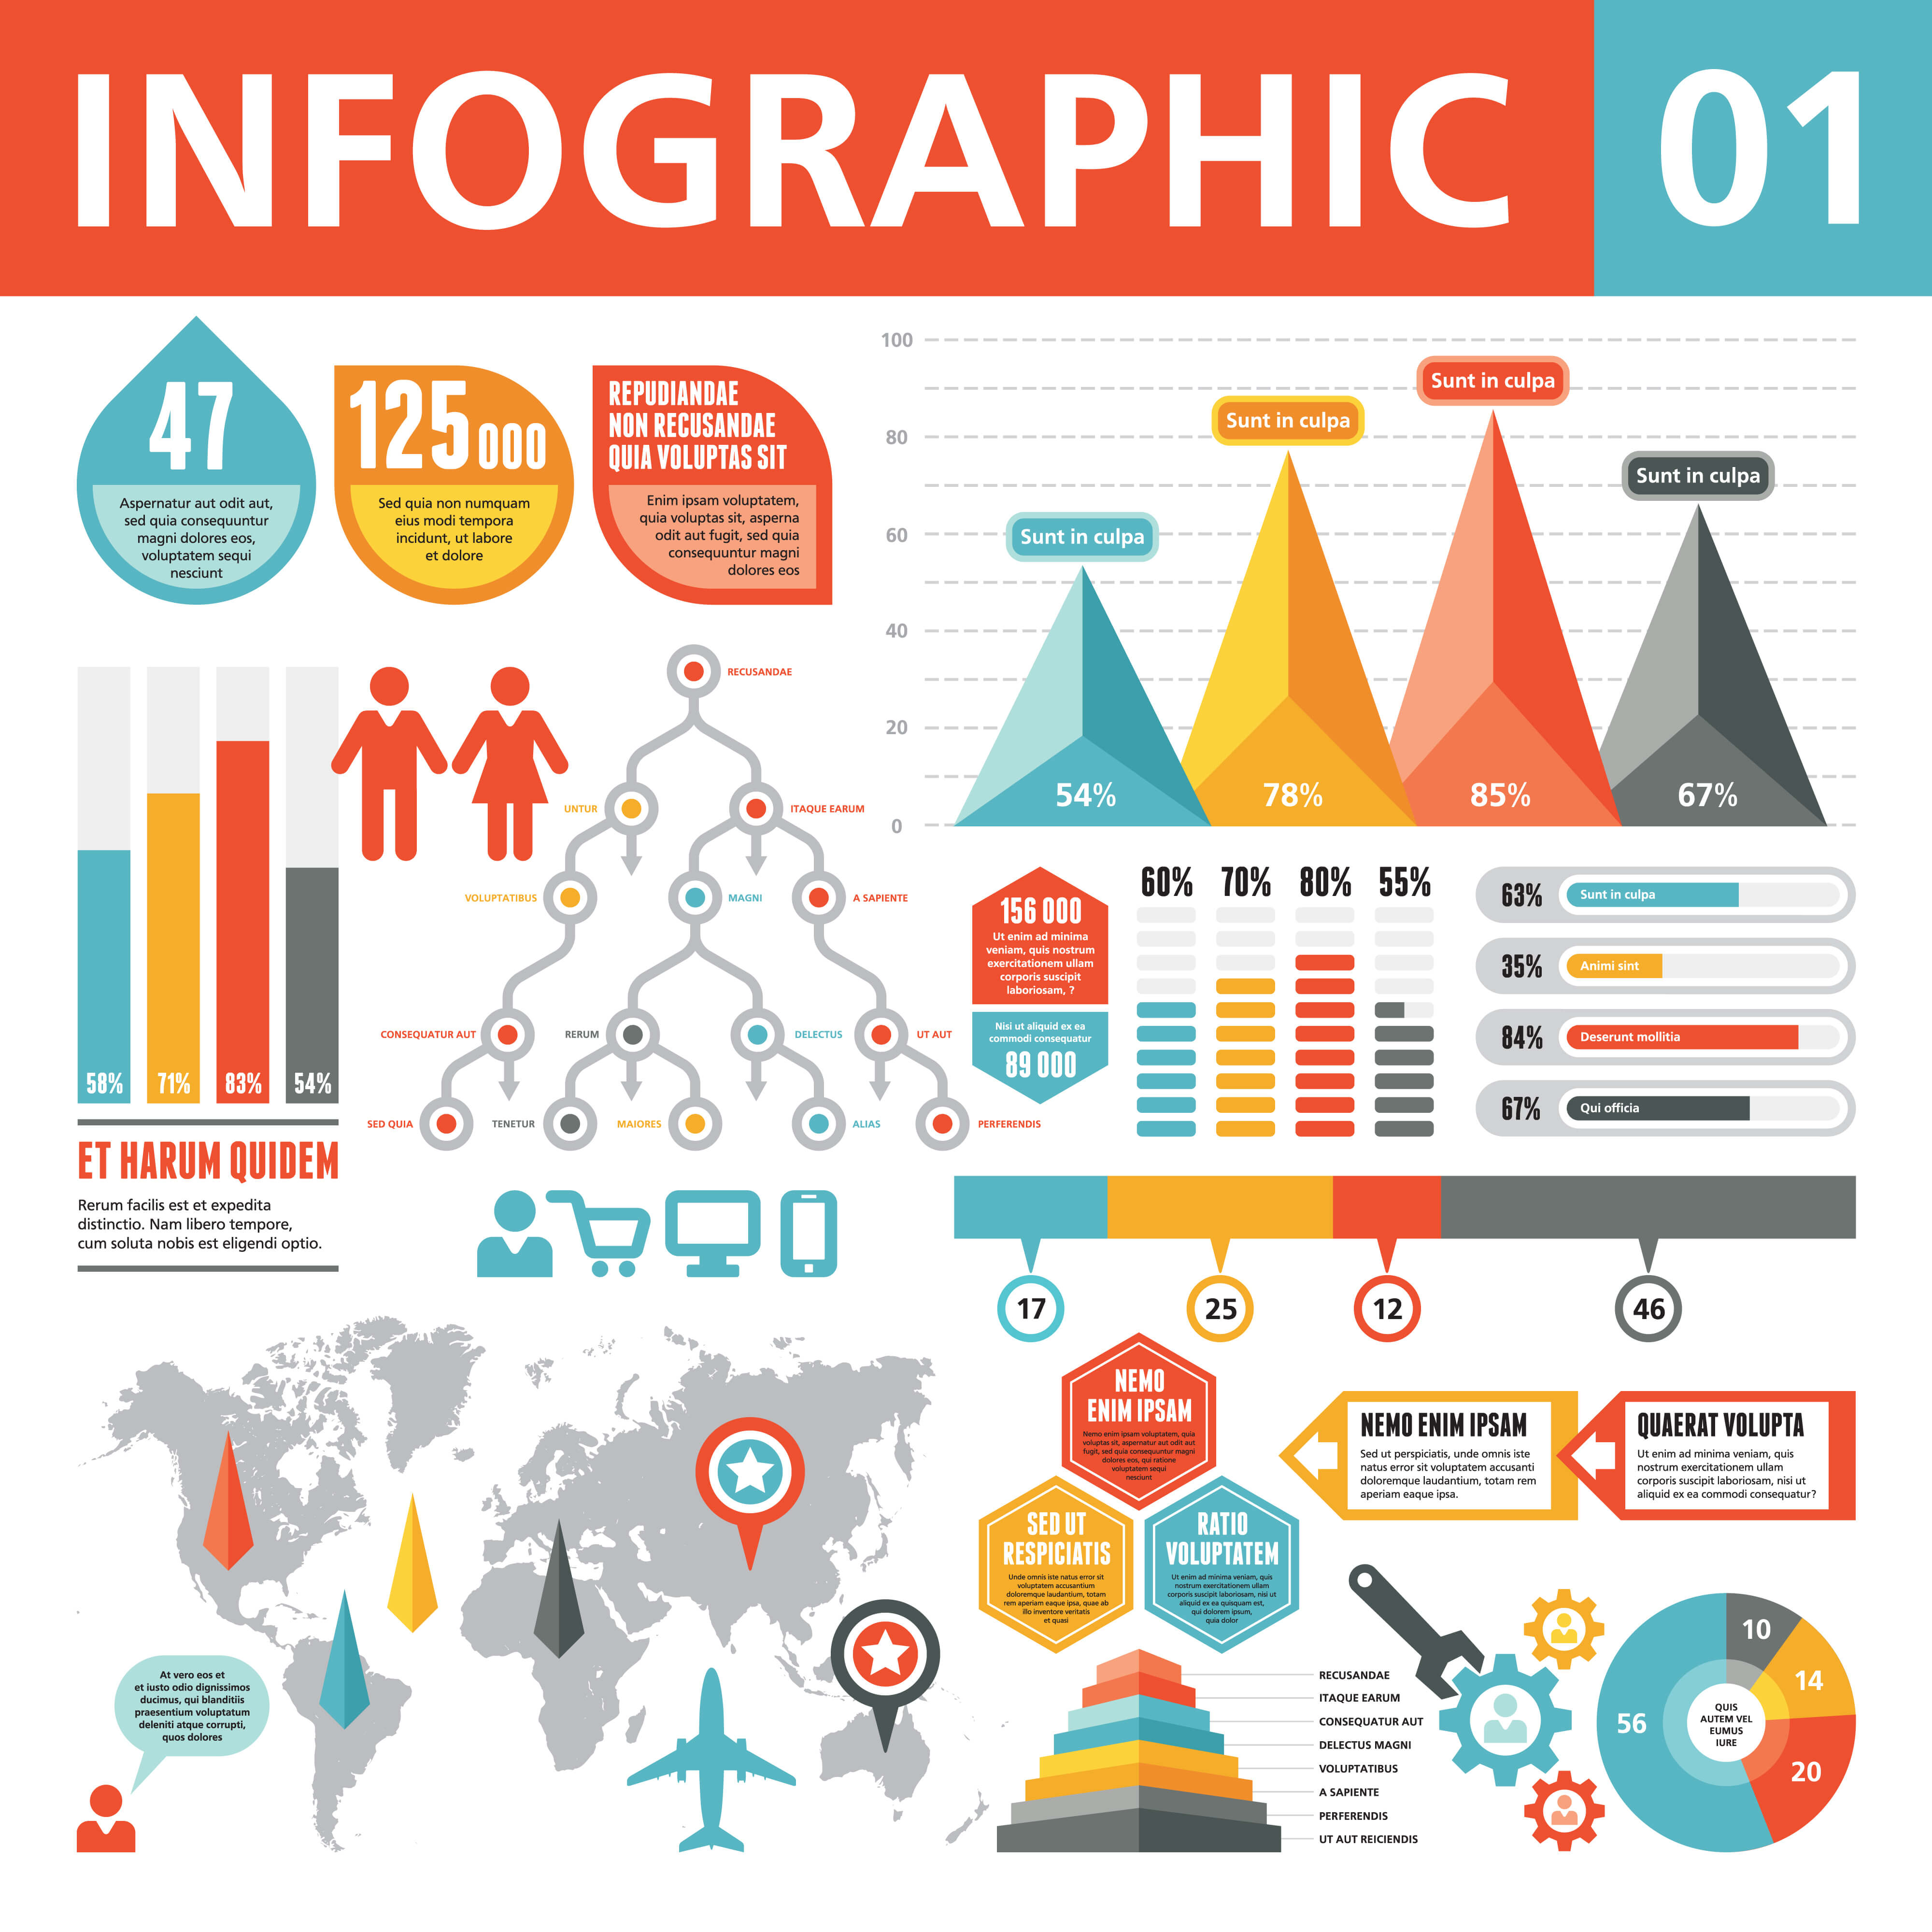
An infographic is a visual representation of information, data, or knowledge intended to present complex information quickly and clearly. They often combine images, charts, diagrams, and minimal text to convey a topic in a visually engaging manner. Their primary purpose is to make complex data easier to understand and more memorable.
But beyond the aesthetic appeal, infographics hold significant value for search engine optimization (SEO). They serve as a compelling medium to attract user engagement, links, and social shares—all of which contribute to better rankings on search engines like Google.
In 2024, with the rise of visual content and the increasing importance of user experience, infographics have become even more crucial for SEO. Search engines prioritize content that keeps users engaged, and infographics do just that by making information more digestible and shareable.
How Infographics Impact SEO Performance
Infographics can influence various aspects of SEO, including:
1. Enhanced User Engagement
Infographics are visually stimulating, which helps grab a user’s attention faster than plain text. Because users are more likely to spend time on a page with an engaging infographic, dwell time increases—a factor that search engines take into account when determining page rankings. A higher dwell time indicates to search engines that users find your content valuable and worth staying for.
2. Attract High-Quality Backlinks
One of the biggest SEO benefits of infographics is their ability to generate high-quality backlinks. When websites and blogs use your infographic, they usually include a link back to your site as the source. Backlinks from reputable websites help improve your site’s domain authority and page rank, signaling to search engines that your content is trustworthy and of high quality.
3. Boosts Social Shares
Infographics are highly shareable on social media platforms. When users find your infographic useful or visually appealing, they are more likely to share it with their audience. These social shares can generate referral traffic, but more importantly, they provide social signals to search engines that your content is popular and engaging.
4. Improved Keyword Optimization
Infographics allow you to optimize various elements for keywords, such as the image file name, alt text, and surrounding text. You can even create a dedicated blog post or page for the infographic, where you can further enhance keyword usage. This gives you a chance to rank for additional terms that might not have been possible through text-based content alone.
5. Increase Traffic and Reduce Bounce Rates
Since infographics present information in a concise and visually appealing way, users are more likely to read and engage with your content instead of immediately leaving the page (which would count as a bounce). Reducing bounce rates is beneficial for SEO, as it signals to search engines that your page is useful and relevant to the user’s query.
6. Target Featured Snippets
With the growing importance of featured snippets (position zero on Google), infographics provide a structured, visually appealing way to present information. Infographics that summarize data, processes, or lists can be particularly useful for earning a featured snippet, which can drastically improve visibility and traffic to your site.
Step-by-Step Implementation Framework
To effectively use infographics that rank and drive traffic, follow this step-by-step framework:
1. Define or Audit the Current Situation
Before creating an infographic, assess your current content and SEO strategy. Identify gaps in your content and determine what topics could benefit from a visual format. Use tools like Google Analytics, SEMrush, or Ahrefs to analyze your website’s performance and identify areas for improvement.
2. Apply Tools, Methods, or Tactics
Once you’ve identified a topic, start gathering data and insights. Use tools like BuzzSumo to research popular content in your niche and identify what works well. Then, choose a platform to create your infographic. Options include Canva, Piktochart, Adobe Express, or even hiring a designer if needed.
3. Measure, Analyze, and Optimize
After publishing your infographic, track its performance using analytics tools. Monitor metrics like traffic, backlinks, social shares, and engagement. Use this data to refine your strategy and improve future infographics.
Real or Hypothetical Case Study
Let’s look at a hypothetical case study of a small business that used infographics to boost its SEO performance.
Background:
A local pest control company wanted to increase its online visibility and attract more customers. They created an infographic titled “Common Bugs That Bite and What They Look Like.” The infographic provided readers with quick, visual information about different types of bugs and their characteristics.
Results:
- Traffic: The infographic received over 19,000 views within the first three months.
- Backlinks: It was featured on multiple industry blogs and websites, resulting in 150+ backlinks.
- Engagement: The infographic generated over 1,000 social shares across platforms like Pinterest and LinkedIn.
- Conversions: The company saw a 20% increase in website inquiries and a 15% rise in bookings.
This case study demonstrates how a well-crafted infographic can significantly impact a business’s online presence and lead generation.
Tools and Techniques for Infographics
Creating and promoting infographics requires the right tools and techniques. Here are some of the best options available:
- Canva – A user-friendly design tool with templates and drag-and-drop features.
- Piktochart – Ideal for creating interactive and visually appealing infographics.
- Adobe Express – Offers advanced design capabilities for more professional-looking visuals.
- Fotor – A simple and intuitive tool for creating quick and effective infographics.
- Visme – Great for creating dynamic and animated infographics.
- Google Slides – A free option for those who want to create basic infographics without any cost.
Each of these tools has its own strengths, so choose one that aligns with your design needs and budget.
Future Trends and AI Implications
As we move further into 2024, the role of AI in content creation and SEO is becoming increasingly prominent. AI-powered tools can now assist in generating infographic ideas, optimizing content, and even creating visuals based on data inputs.
For example, AI can analyze trends and suggest topics that are likely to resonate with your audience. It can also help automate the design process, allowing you to create high-quality infographics faster and more efficiently.
Looking ahead, the integration of AI with infographic creation will likely become more seamless, enabling businesses to produce more targeted and impactful content. To stay ahead, focus on leveraging AI tools to enhance your workflow and maintain a competitive edge.
Key Takeaways
- Infographics are powerful tools for SEO, helping to increase engagement, backlinks, and traffic.
- They should be valuable and visually appealing, solving a specific problem for your audience.
- Optimize them for keywords by using descriptive file names, alt text, and surrounding content.
- Promote your infographic through social media, email outreach, and infographic directories.
- Track and analyze your infographic’s performance to refine your strategy.
- Stay ahead of the curve by leveraging AI tools to streamline your infographic creation process.
By following these steps and continuously refining your approach, you can create infographics that not only rank well in search engines but also drive meaningful traffic to your website.
Meta Title: How to Use Infographics That Rank & Drive Traffic: A Complete Guide for 2024
Meta Description: Learn how to create and promote infographics that boost SEO, drive traffic, and increase engagement in 2024.
SEO Tags (5): infographics, SEO, traffic, content marketing, digital marketing
Internal Link Suggestions: [Parameter #1: Content Marketing Strategies], [Parameter #2: On-Page SEO Techniques], [Parameter #3: Social Media Marketing]
External Source Suggestions: https://www.semrush.com/, https://www.buzzsumo.com/, https://www.canva.com/